The gap between the line and the ground
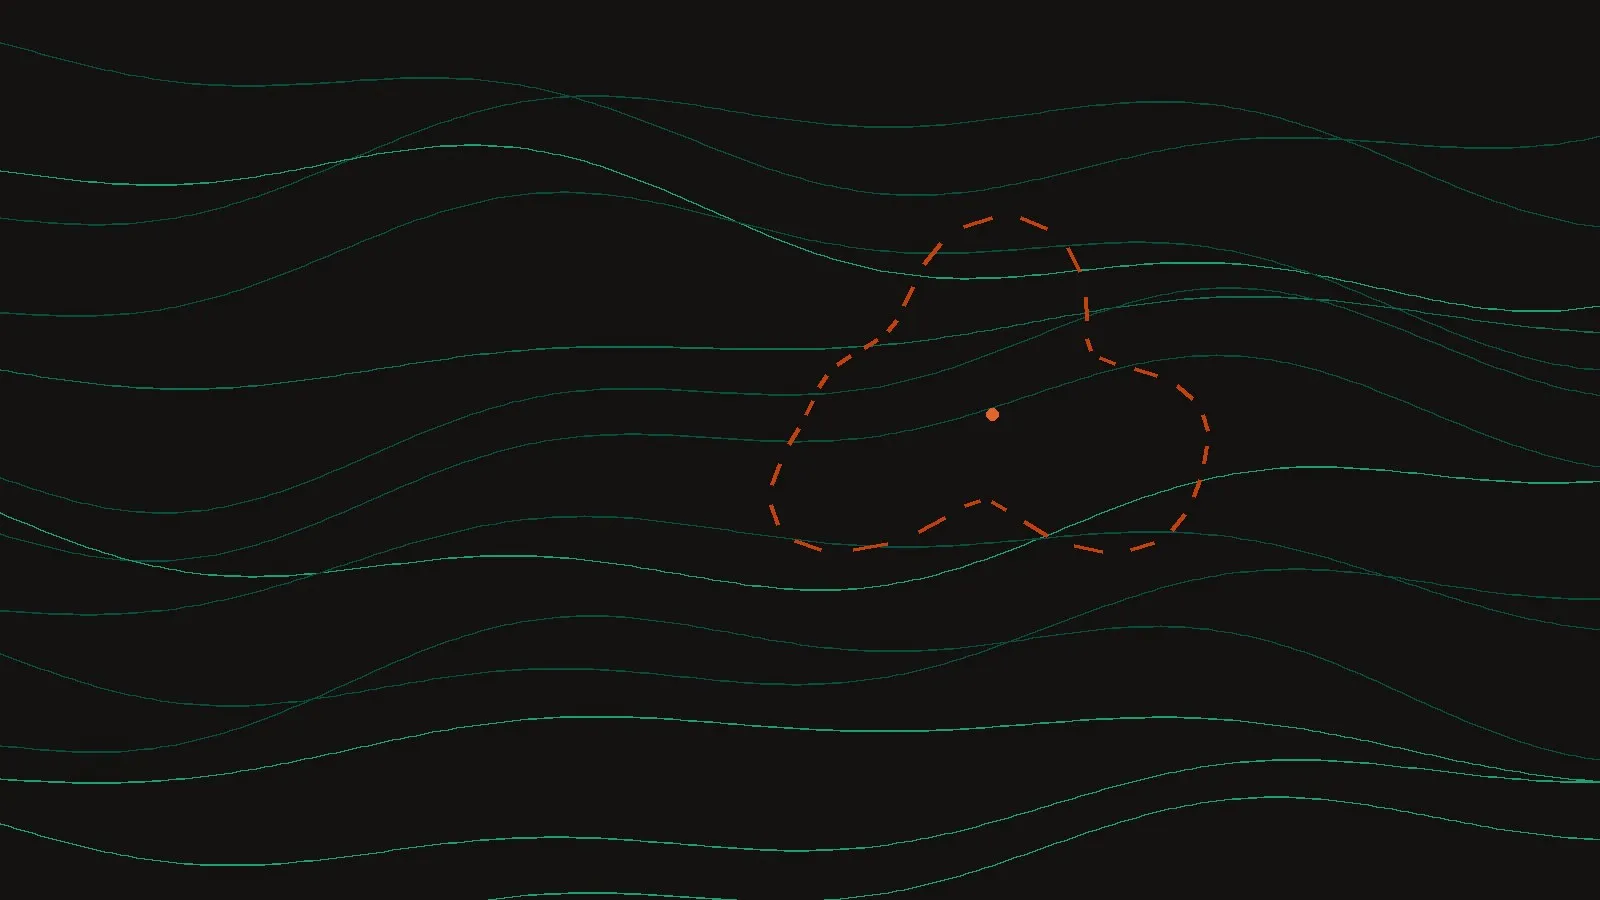
The perimeter published on September 3 placed the fire’s western edge a full ridge east of where it burned. Ground truth from seventeen drone flights tells a different story, one with consequences for every evacuation model built on the official line.1
Fire seasons in the western United States have lengthened measurably over the last four decades, a shift attributed in large part to anthropogenic climate change (Abatzoglou & Williams, 2016). As seasons lengthen, the mapping systems built for shorter, slower fires are asked to do more than they were designed for.
This is a demonstration of bold, italic, and inline code, plus a
standard link — the ordinary Markdown an
author reaches for first.
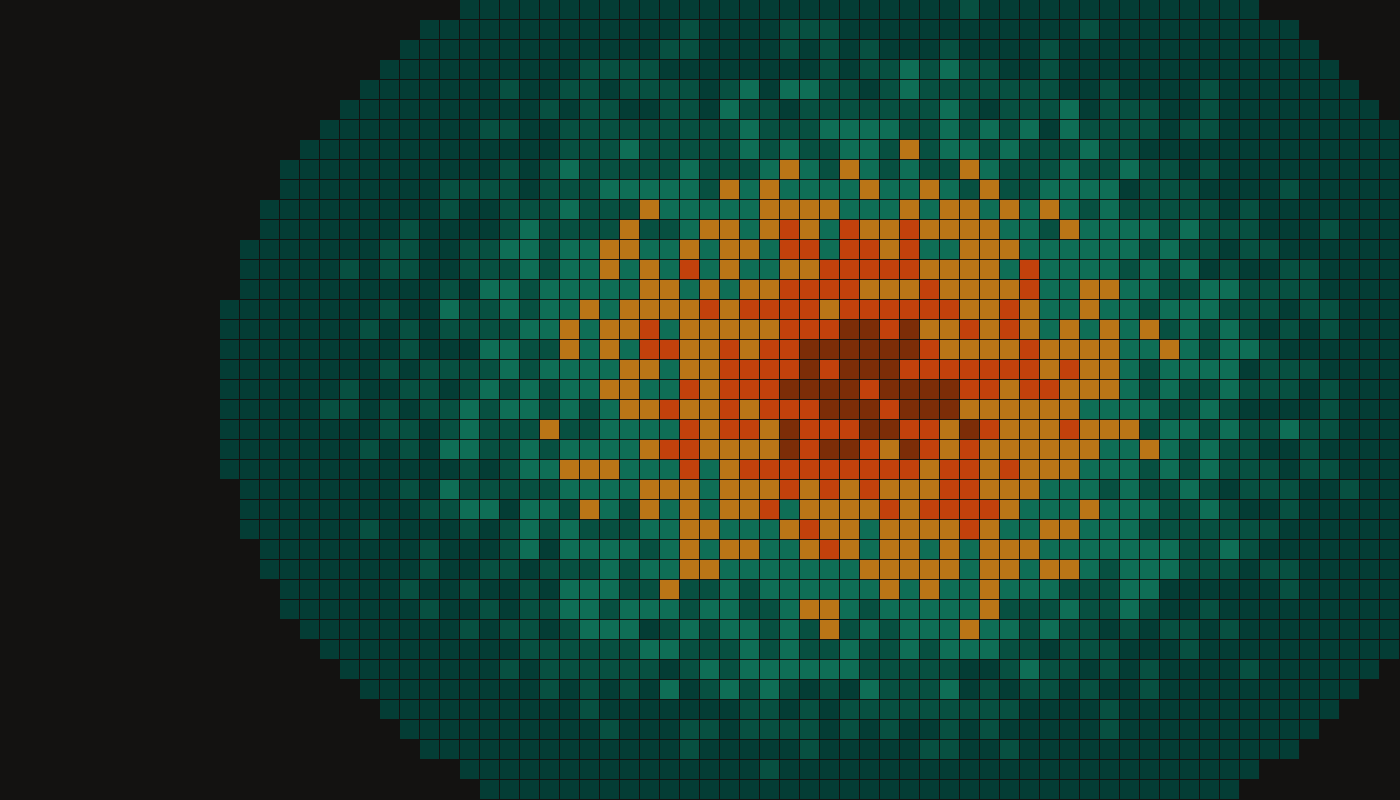
What the drone surveys show
Burn severity was classified from multispectral imagery using the Normalized Burn Ratio, following the landscape-assessment protocol established for FIREMON (Key & Benson, 2006).
The perimeter itself, mapped across three synthetic observation days, is served as GeoJSON straight from the dataset this article ships with:
Growth over the first two weeks follows the familiar early-exponential curve before containment lines hold:
Sequence of events
-
Sep 1, 2025
Ignition reported
Initial attack within four hours; perimeter mapping begins the following morning.
-
Sep 3, 2025
Official perimeter diverges
Published line places the western edge one ridge east of drone-observed fire.
-
Sep 5, 2025
First containment
Containment reaches 6% as the synthetic growth curve begins to flatten.
-
Sep 14, 2025
Survey series complete
Seventeenth and final drone flight closes the observation record.
The data behind this article
Every investigation publishes its evidence. The perimeter dataset is documented, licensed, checksummed, and citable on its own landing page:
Reproducing the growth chart takes a few lines — code blocks get Shiki highlighting on the obsidian surface automatically:
import geopandas as gpd

perimeters = gpd.read_file("perimeters.geojson")
perimeters["area_ha"] = perimeters.to_crs(epsg=5070).area / 10_000
print(perimeters[["date", "area_ha"]])
Observation days summarize into an ordinary Markdown table:
| Day | Date | Area (ha) | Containment |
|---|---|---|---|
| 1 | Sep 1, 2025 | 210 | 0% |
| 2 | Sep 2, 2025 | 290 | 0% |
| 3 | Sep 3, 2025 | 405 | 0% |
Live context
Related monitoring lives in a self-contained dashboard, embedded here and maintained independently of the article:
Surveillance technology exports
Open full screen ↗A perimeter is a claim about the world. Like any claim, it can be checked.
The divergence documented here is small in hectares and large in consequence: evacuation zones, insurance assessments, and post-fire funding all inherit the official line’s errors.
Footnotes
-
Footnotes render at the end of the article. This one demonstrates the GFM footnote syntax: a caret-bracket marker in prose, a matching definition anywhere in the file. ↩
From this investigation
- Interactive mapOregon fire perimeter growth
GeoJSONCSV