The signal in the vulnerability firehose
Tens of thousands of new software vulnerabilities are catalogued every year, and the overwhelming majority are never exploited by anyone. The central problem of vulnerability intelligence is not collecting them — the feeds are public and abundant — but separating the handful that are actively dangerous right now from the vast background of the merely possible. This is the same craft the wildfire pieces on this site describe: raw detections are cheap, and the value is in the disciplined cross-referencing that turns them into a defensible picture.
This piece builds a daily instrument for that problem, mirroring the wildfire pulse architecture exactly — a scheduled ETL, immutable dated snapshots, a dashboard that replays any past day. The domain changes from geography to threat data; the discipline does not.
What the pipeline models
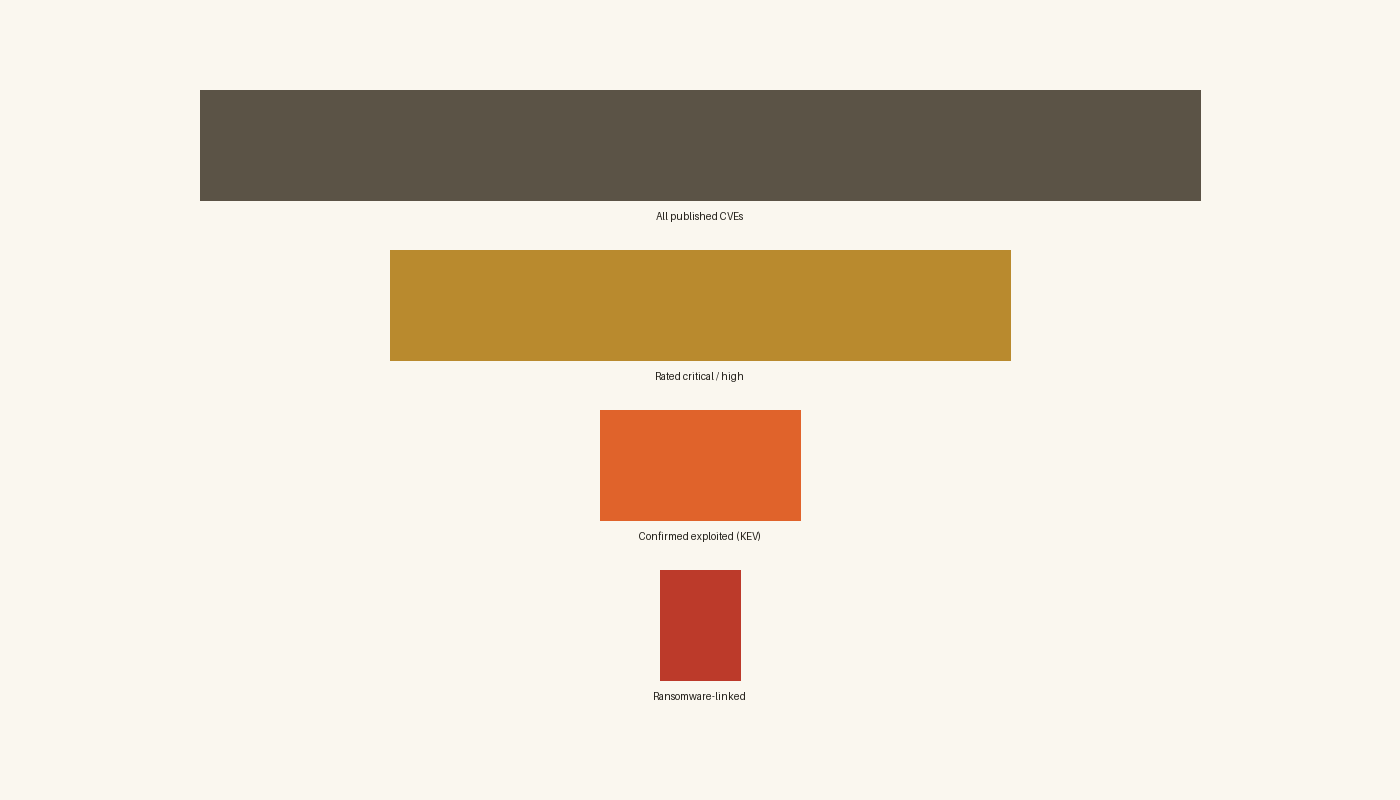
The pipeline answers a bounded question each day: of everything published, which vulnerabilities are confirmed exploited, which of those are severe, and what extortion activity is visible around them? Four public feeds, each with a distinct evidentiary weight, combine into that answer.
CISA Known Exploited Vulnerabilities — the spine
The KEV catalog is the strongest single feed in cyber intelligence because it carries the one fact most vulnerability data lacks: confirmation that a vulnerability has actually been exploited in the wild [@cisakev]. Established by CISA’s Binding Operational Directive 22-01, the catalog sets federal remediation deadlines and, in doing so, became the closest thing the field has to an authoritative “patch this now” list [@cisabod]. When a CVE enters KEV, the conversation shifts from could this be attacked to this is being attacked.
What it cannot tell you is completeness. KEV is confirmed exploitation, not all exploitation — a vulnerability absent from KEV is not proven safe, only unconfirmed. The catalog also reflects CISA’s visibility and priorities, which center on threats to US federal networks.
NVD severity — the scale
The National Vulnerability Database enriches CVEs with CVSS severity scores, letting the pipeline rank the field [@nvd]. Severity, following the CVSS 3.1 standard, estimates how bad exploitation would be — attack vector, complexity, and impact — independent of whether it is happening [@first_cvss]. It answers “how dangerous,” never “how likely.” A critical-rated CVE with no evidence of exploitation is a different object from a medium-rated one already in KEV, and the pipeline’s most useful correlation is precisely their intersection: severe and confirmed-exploited.
CISA advisories — the context
Published advisories add the narrative the raw feeds omit: which sectors, which products, what mitigations [@cisaadvisories]. They are lower-frequency and human-authored, and they age — an advisory is a snapshot of understanding at publication, not a live status.
Ransomware activity — the consequence, heavily caveated
The final layer is the most consequential and the least trustworthy: victim postings scraped from ransomware groups’ own leak sites. These show which extortion operations are active and which sectors they are hitting, but every entry is an unverified claim made by a criminal enterprise for its own purposes. The pipeline surfaces this as reported activity and never as established fact — the single most important framing choice in the whole system.
What the correlations can and cannot say
The intelligence is in the joins. A KEV entry flagged for ransomware use, sitting next to a spike in that group’s leak-site postings, sketches the exploitation-to-extortion pipeline in a way no single feed does. An NVD critical that also appears in KEV is the highest-priority object the system can identify: severe and confirmed-exploited at once.
But the correlations inherit every source limit, and stack them. Leak-site attribution cannot establish that a specific vulnerability caused a specific breach — the co-occurrence is suggestive, not causal. Country tags mark victim nationality, not attacker location. And the daily cadence means the picture is always at least a day behind the fastest-moving campaigns. The pipeline states these limits in the interface, next to the numbers they qualify.
Dashboard walkthrough
The dashboard below runs on the synthetic sample set and mirrors the wildfire pulse layout: status cards, a world map of ransomware victim claims sized by country, a table of confirmed-exploited criticals, the recent KEV additions, and season trend charts. The date selector replays any past snapshot.
Cyber intelligence dashboard — prototype on sample data
Open full screen ↗How the KEV instrument evolved
-
1999
CVE identifiers begin
MITRE establishes the common vulnerability naming scheme the whole field still uses.
-
2005
NVD launches
NIST begins enriching CVEs with severity scoring and structured metadata.
-
2019
CVSS 3.1
The severity standard the pipeline reads for critical/high classification.
-
2021
BOD 22-01 and KEV
CISA creates the Known Exploited Vulnerabilities catalog with binding federal deadlines.
-
2023
NVD API 2.0
Modern JSON API with CISA-KEV enrichment fields; the version this pipeline targets.
Roadmap
-
Phase 1 — shipped
Daily ETL + dashboard on sample data
KEV, NVD, advisories, and ransomware feeds; correlations; immutable snapshots; replay.
-
Phase 2
Live keyless feeds
KEV, advisories, and NVD (keyless) against real endpoints; freshness from real timestamps.
-
Phase 3
Enrichment and history
EPSS exploitation-probability scores, keyed NVD, and a rolling archive for retrospective analysis.
-
Phase 4
Sector and supply-chain views
Cross-reference product/vendor exposure against ransomware sector targeting.
The through-line matches the rest of this publication: the instrument earns trust by being precise about what it confirmed and more precise about what it only suspects. In vulnerability intelligence, the difference between “scored critical” and “confirmed exploited” is the whole discipline — and a dashboard that blurs it would be worse than none.