Oregon enters the 2026 fire season carrying two liabilities at once. The winter’s snowpack collapsed: on April 1 the statewide snow water equivalent set a new record low for the SNOTEL era and for a snow-course record reaching back 98 years, surpassing the benchmark bad winters of 1977 and 2015 [@nrcs2026wsor]. And the ocean has turned: NOAA’s Climate Prediction Center now places El Niño conditions in the tropical Pacific, expected to strengthen through the coming winter, with a 96 percent chance of persisting through December 2026–February 2027 [@cpc2026enso]. In the Pacific Northwest, El Niño winters lean warm and dry — dryness that tends to carry into the following summer.
The question this piece asks is narrower than a forecast: what does Oregon’s own fire record say about seasons that begin this way? To answer it, this investigation joins three public datasets — every fire the Oregon Department of Forestry recorded on its protected lands from 2000 through 2025 [@odf2026], the burned-area perimeters mapped by the federal Monitoring Trends in Burn Severity program [@mtbs2026], and the weekly Drought Severity and Coverage Index for Oregon from the U.S. Drought Monitor [@usdm2026] — into one year-by-year table, published in full at the end of this article.
A quarter century of ignitions
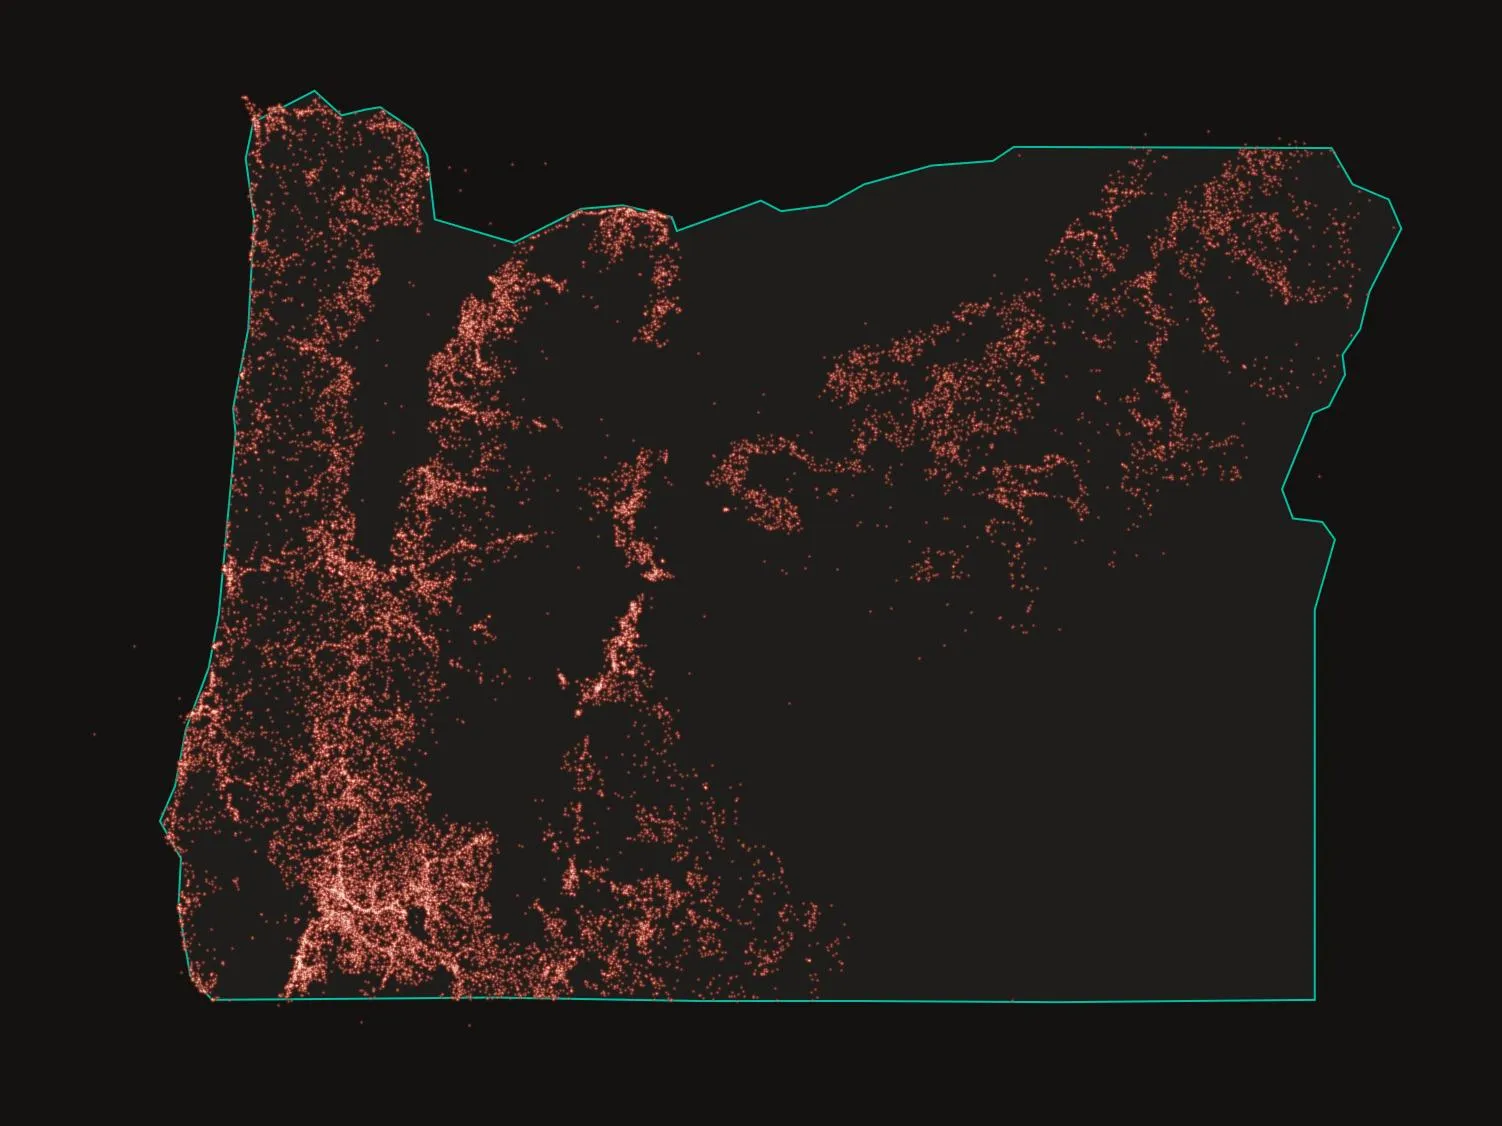
The ODF occurrence database records 26,817 fires on ODF-protected land between 2000 and 2025 — roughly a thousand a year, with surprisingly little trend. The busiest year in the record (2006, with 1,342 starts) has only about twice the ignitions of the quietest (689, in 2012).
Acreage tells a different story. Estimated acres burned on ODF-protected land do not creep — they spike. Two of the record’s three worst years came in the last six: 2020 (about 1.15 million ODF-estimated acres) and 2024 (about 1.09 million), joining 2002, the year of the Biscuit fire, whose 499,945 ODF-recorded acres remain the largest single entry in the database.
The gap between those two charts is the central fact of the record. Ignition counts and acreage burned are only weakly related — the year-to-year correlation in this table is about 0.19. The median recorded fire is 0.1 acre; roughly 94 percent of all fires in the database are held under 10 acres. The top one percent of fires account for about 98 percent of all recorded acreage. Oregon’s fire problem is not that fires start. It is that, in certain years, a few of them cannot be stopped.
Who lights them, and what gets big
Nearly three in four recorded ignitions are human-caused: 19,700 of the 26,817 fires, against 7,040 attributed to lightning. Lightning is the single largest cause category, but equipment use (5,565 fires) and debris burning (5,184) together exceed it, and recreation adds 3,348 more.
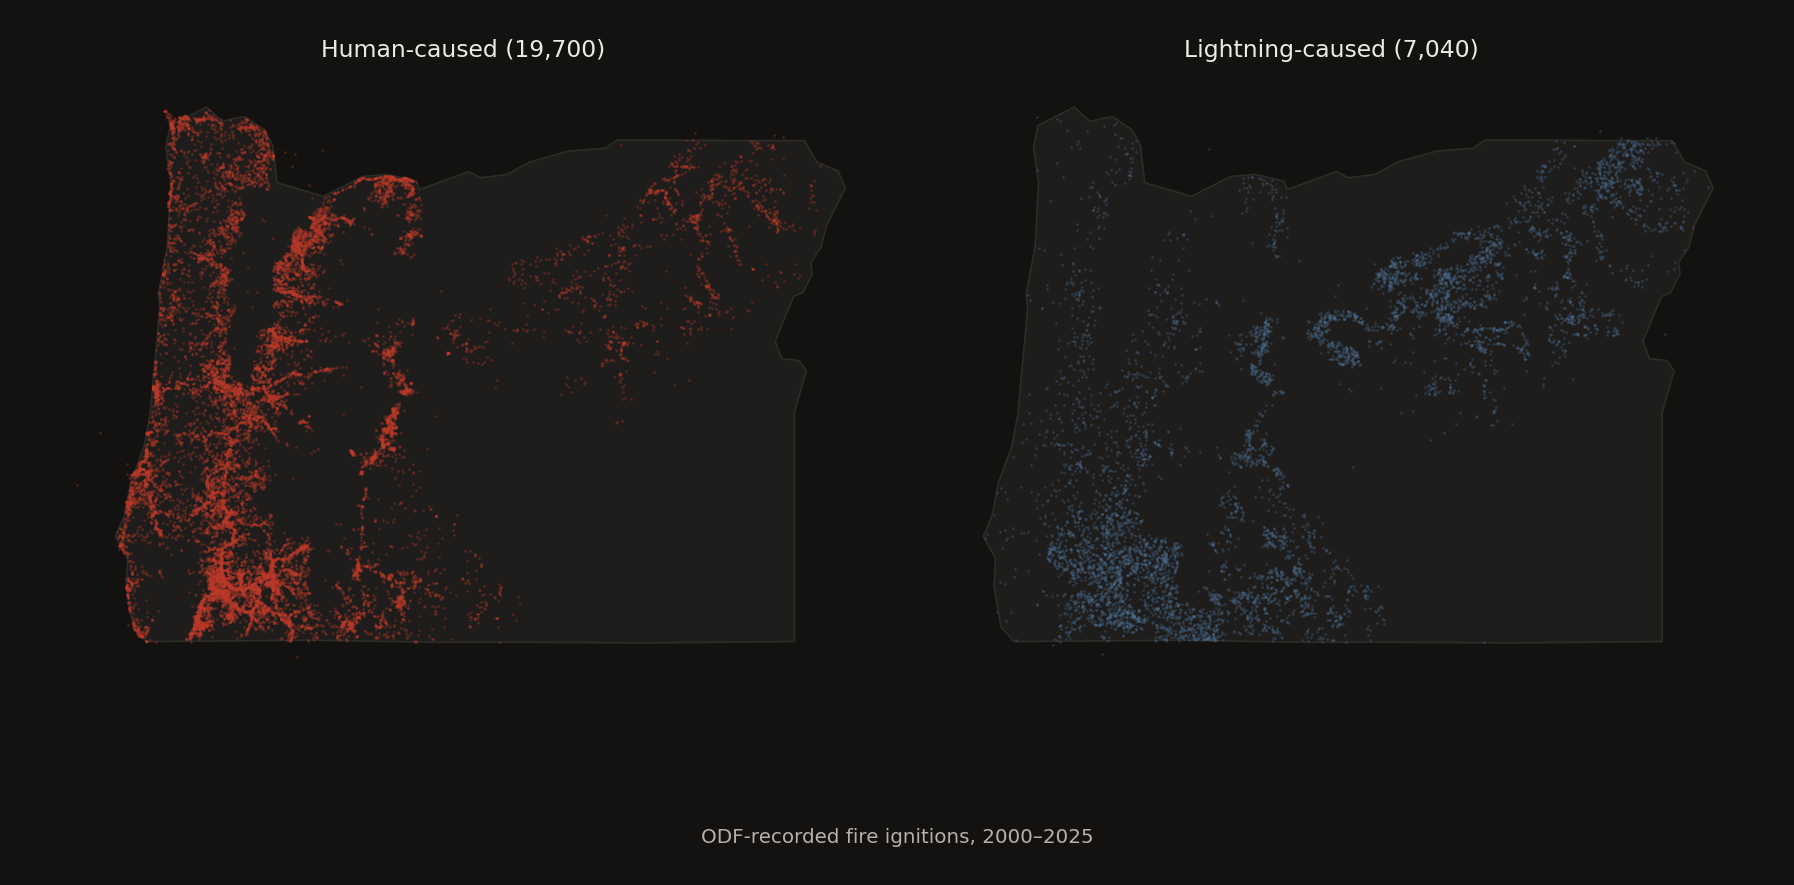
Cause and consequence diverge, though. In each of the record’s four heaviest acreage years, the largest fire of the year was lightning-caused: Biscuit in 2002, Lionshead (204,469 ODF-recorded acres) in 2020, Bootleg (413,744) in 2021, and Durkee (294,265) in 2024. People start most of Oregon’s fires; lightning, striking remote and dry terrain, starts a disproportionate share of the fires that define a season.
Starts are not burns
The ODF database records where fires began and what ODF estimated they consumed — but only on ODF-protected land. The MTBS program maps the actual footprints of large fires regardless of jurisdiction, and its Oregon totals run consistently higher. By the MTBS accounting, 2024 was the heaviest year in the window, with about 1.60 million acres of large-fire footprint, ahead of 2012 (1.51 million — a year that barely registers in the ODF acreage chart, because its largest fire, a 557,000-acre burn in the southeast, touched little ODF-protected ground) and 2020 (1.23 million).
Reading the two sources against each other is the discipline this record demands: a start is not a burn, and an agency’s estimate is bounded by its jurisdiction. Where they disagree, the disagreement is usually a map of who protects what.
The drought signal
The Drought Monitor’s DSCI compresses statewide drought extent and severity into a single number from 0 to 500. Averaged over the May–September fire season, it marks the years Oregonians remember: 2021 (fire-season mean of 354, the highest in the record), 2015 (329), 2001 (301), 2014 (245).
The relationship between drought and burned area is real but loose. Across 2000–2024, the seven driest fire seasons by DSCI averaged about 839,000 acres of MTBS-mapped footprint; the seven wettest averaged about 533,000 — roughly 1.6 times more burning in the dry years. The straight correlation between fire-season DSCI and MTBS acres is only about 0.29, and the exceptions cut both ways: 2012 and 2017 burned enormously in unremarkable drought years, while drought-heavy 2022 finished near the middle of the acreage table. Drought loads the dice; wind, ignition timing, and where lightning happens to strike still throw them.
The setup for 2026
Which returns us to the season now underway.
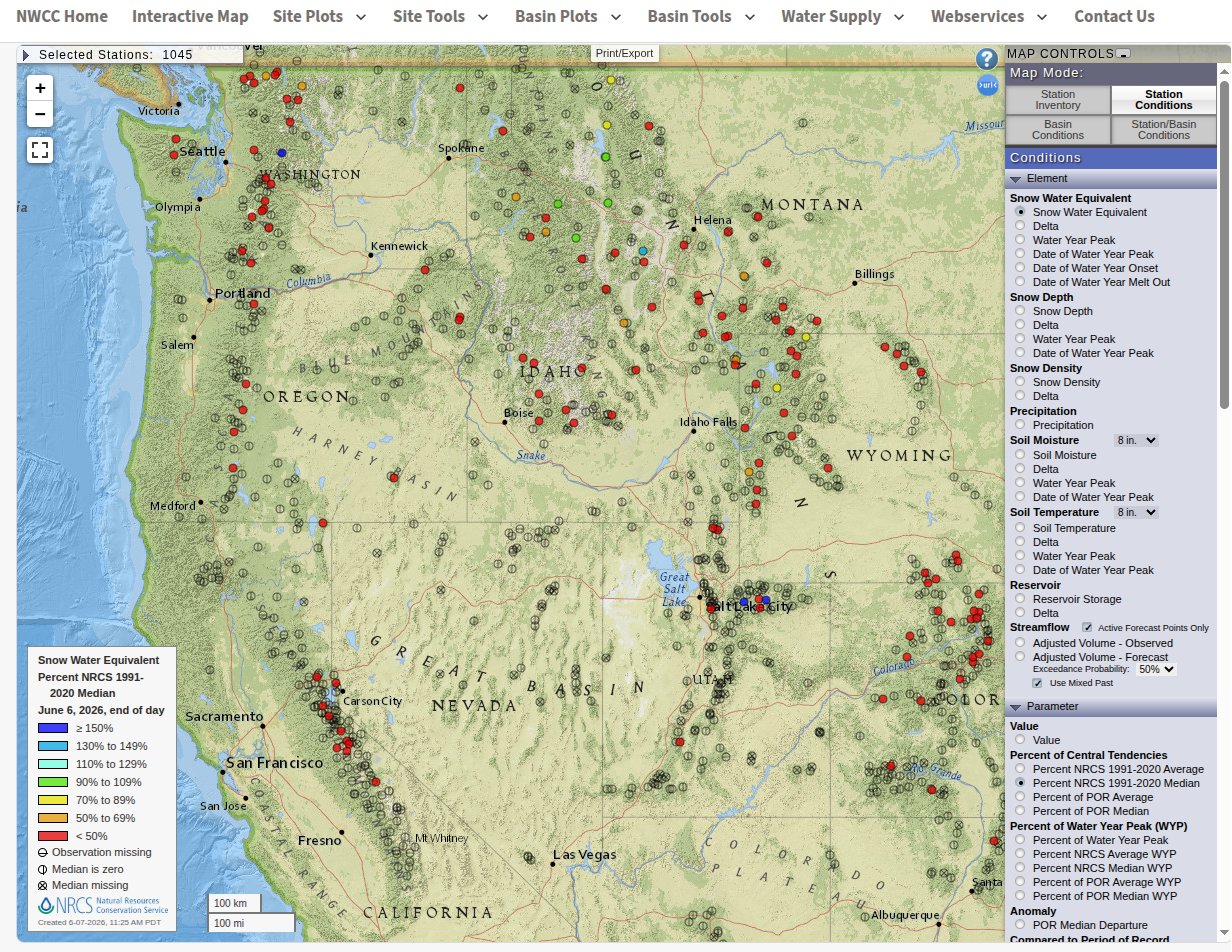
The federal assessments behind that map are blunt. NRCS’s April 1 outlook called the water-supply picture “poor statewide,” with 61 of 73 forecast points expected to fall within the lowest 15 percent of runoff volumes on record [@nrcs2026wsor]. The interagency snow-drought update in May counted 62 of Oregon’s 73 forecast points approaching or at historic lows, in the state’s second-warmest water year since 1895 [@nidis2026]. And the winter that produced this was a weak La Niña — the phase that is supposed to be Oregon’s cool, wet one. The strengthening El Niño now in place tilts the odds toward warm and dry continuing [@cpc2026enso].
Set against the record above, the pattern is uncomfortable. The heaviest burn years cluster where dry winters meet dry summers, and lengthening, warming fire seasons across the western U.S. have been attributed in substantial part to anthropogenic climate change [@abatzoglou2016w]. The conditions that usually precede a bad Oregon year are already in place.
-
2002
Biscuit
Lightning ignition in the Siskiyous grows to 499,945 ODF-recorded acres — still the largest single entry in the 26-year database.
-
2012
The invisible big year
MTBS maps 1.51 million acres of large-fire footprint, most of it off ODF-protected land — a year the ODF ledger alone would miss.
-
2020
Labor Day
About 1.15 million ODF-estimated acres, the worst in the record; Lionshead alone accounts for 204,469.
-
2021
Bootleg
The driest fire season in the drought record (DSCI 354) produces a 413,744-acre fire in Klamath County.
-
2024
Durkee and the new high-water mark
MTBS maps 1.60 million acres, the largest footprint in the window; Durkee reaches 294,265 ODF-recorded acres in Baker County.
What this cannot tell you
The honest reading is conditional. The record does not say Oregon will burn in 2026. It says the years that burned worst tended to begin the way this one has begun — and that the state’s ignition load, three-quarters of it human, is the one variable in the table that policy and behavior can actually move before August.1
The data behind this article
The six cleaned tables built for this investigation — annual and county-level fire summaries, cause breakdowns, MTBS totals, drought summaries, and the joined story table — are documented, checksummed, and downloadable from the dataset page.
Reproducing the headline skew statistics takes four lines against the raw ODF extract:
library(tidyverse)
fire <- read_csv("ODF_Fire_Occurrence_2000-2025.csv")
acres <- sort(fire$EstTotalAcres, decreasing = TRUE)
sum(head(acres, n = length(acres) * 0.01), na.rm = TRUE) / sum(acres, na.rm = TRUE)
A fire season is a claim the climate makes in advance. The record is how we check it in arrears.
Footnotes
-
Human-caused shares by year range from 56 percent (2013) to 91 percent (2016) in the ODF record; the 26-year average is 73.5 percent. ↩